TRENDING REPORTING COURSES
Power BI | MS-SQL | Power Apps | Power Automate
Power BI | MS-SQL | ETL with SSIS | VBA | SSAS
Power BI | Power Pivot | Power Query | Basic DAX
Advanced Excel | MIS Reporting | Model Building
Advanced Excel | MIS Reporting | Power Query
VB Programming | VBA | MS-Office Automation
Formulas | Pivots | Advance Dashboards
TAILORED BI REPORTING COURSES
BY INDUSTRY
Course on Management Reporting & Business Modeling using MS-Excel.
20-hrs Course | 60+ Advanced Formulas | 7 Reporting Projects | View Schedule
This is a 20-hour, activity-based program, designed to give you extensive exposure on mining, structuring and, modeling varied data to come up with the required analysis and MIS Reports using Microsoft Excel.
Master the Excel essentials of the real world and accelerate your career.
This section aims to bring all the candidates to the same level before moving to the most intensive, advanced and complex topics. It aims to equip you with a strong foundational knowledge of Excel to organize, analyze and work with data.
Why do I need a quick Excel brush-up?This section will cover 60+ essential, productive time-saving functions and formula-building techniques through suitable examples, required to solve a variety of data analysis problems. You'll also learn how to debug a formula, audit them, and simplify the complex functions.
Overview of 60+ FormulasThis section is designed for Excel users to crunch numbers substantially, create reports dynamically using PivotTable, and, present professional information through Dashboards in Microsoft Excel that are beautiful, precise, and clear.
Pivots, Charts & DashboardsThis section will help you plug in all the Advanced Excel concepts learned in previous sections to work on various MIS reports such as summary reports, trend reports, exception reports, financial reports, inventory reports, sales reports, budget reports, etc.
Different types of MIS ReportsThis is the most important step for all the reporting requirements. You'll learn to prepare raw data for analysis by removing bad data, organizing the raw data, and filling in the null values. Data cleaning in data mining has utmost value when working with big data.
Common types of data errorsBudgeting and financial forecasting are tools that companies use to establish a plan for where management wants to take the business budgeting and whether it is heading in the right direction—financial forecasting. This section will guide you to build such models.
Different types of forecasting & budgeting models* |
Please note that topics marked with an asterisk are advanced concepts beyond the regular Excel program and require an additional cost. Alternatively, our comprehensive Full Stack BI Reporting Course covers all these exciting topics. |
This section aims to bring all the candidates to the same level before moving to the most intensive, advanced and complex topics. It aims to equip you with a strong foundational knowledge of Excel to organize, analyze and work with data.
All the participants come from different domain with different levels of Excel expertise. Brush-up will help you to fill up the gaps and get everyone at the same level to proceed with intense sessions. This will also ensure a structured learning.
This section will cover 60+ essential, productive time-saving functions and formula-building techniques through suitable examples, required to solve a variety of data analysis problems. You'll also learn how to debug a formula, audit them, and simplify the complex functions.
1. Sum
2. Sumif
3. Sumifs
4. Average
5. Averageif
6. Averageifs
7. Max
8. Min
9. Sumproduct
10. Count
11. CountA
12. Countblank
13. Subtotal
1. Vlookup
2. Dynamic Vlookup
3. Hlookup
4. Dynamic Hlookups
5. Match
6. Index
7. Indirect
8. Offset
1. Istext
2. Code
3. Char
4. Exact
5. Len
6. Trim
7. Upper
8. Lower
9. Proper
10. Left
11. Right
12. Mid
13. Substitue
14. Replace
15. Find
16. Search
1. Date
2. Datevalue
3. Day
4. Days360
5. EDate
6. Emonth
7. Month
8. Today
9. Weekday
10. Year
11. Now
12. Hour
13. Minute
14. Second
15. Time
16. Timevalue
1. Ceiling
2. Even
3. Floor
4. INT
5. Mround
6. Odd
7. Round
8. Roundup
9. Rounddown
10. Trunc
1. Isna
2. Iserr
3. Iserror
This section is designed for Excel users to crunch numbers substantially, create reports dynamically using PivotTable, and, present professional information through Dashboards in Microsoft Excel that are beautiful, precise, and clear.
Getting started with Power BI is simple. Then, once you want to leverage its full potential, you need a different set of skills. Learn how to develop these skills, unlock more insights through better data analysis and visualization with this section.
Different types of MIS reports aggregate different data points and present them in a format that provides clear insights and conclusions. The various departments in an organization present MIS report which outline their department’s specific functions. There can be different types of MIS reports based on which data is being analyzed and what it is being used for. We’ve tried to summarize the most 15 common types of MIS reports which you will find in an organization.
This is the most important step for all the reporting requirements. You'll learn to prepare raw data for analysis by removing bad data, organizing the raw data, and filling in the null values. Data cleaning in data mining has utmost value when working with big data.
Data cleansing, also referred to as data cleaning or data scrubbing, is the process of fixing incorrect, incomplete, duplicate or otherwise erroneous data in a data set. It involves identifying data errors and then changing, updating or removing data to correct them.
Data cleansing is a key part of the overall data management process and one of the core components of data preparation work that readies data sets for use in business intelligence (BI) and data science applications.
It's typically done by data quality analysts and engineers or other data management professionals. But data scientists, BI analysts and business users may also clean data or take part in the data cleansing process for their own applications.
Common data errorsBudgeting and financial forecasting are tools that companies use to establish a plan for where management wants to take the business budgeting and whether it is heading in the right direction—financial forecasting. This section will guide you to build such models.
A budget model is a framework for how you create and manage your budget.
Most people are familiar with the different approaches to budgeting for personal finances like the envelope method or 50/30/20.
Similarly, there are multiple approaches to creating a budget for your business.
5 most common types of budget models used
There are three basic types—qualitative techniques, time series analysis and projection, and causal models. The first uses qualitative data (expert opinion, for example) and information about special events of the kind already mentioned and may or may not take the past into consideration.
The second, on the other hand, focuses entirely on patterns and pattern changes, and thus relies entirely on historical data.
The third uses highly refined and specific information about relationships between system elements and is powerful enough to take special events formally into account. As with time series analysis and projection techniques, the past is important to causal models.
* |
Please note that topics marked with an asterisk are advanced concepts beyond the regular Excel program and require an additional cost. Alternatively, our comprehensive Full Stack BI Reporting Course covers all these exciting topics. |
Excel Learning Redefined.
LEARN from Microsoft Certified Trainers
PRACTICE with real-time Assignments
REVISE with 10+ Case Studies
SPEED-UP with our Excel Shortcut Tool
ON-JOB Support to implement learnings
A snapshot of what you'll be learning in 2 weeks.
Objective: The term "basic" is subjective based on levels of knowledge, experience, exposure, etc. Basic for one individual doesn't have to be basic for another. Nearly all participants in this training are self-taught and have some Excel skills as well as some gaps.
The objective of this module is to fill gaps, bring everyone to the same level and empower them with comfort and confidence to learn Excel as a reporting solution and not as a computer tool.
Duration – 2.5 Hours (Rapid Session)
Objective: Master 60+ MS Excel formulas to dramatically simplify the work you do in Excel. By the end of the section, you'll be writing robust, elegant formulas from scratch.
Duration – 5 Hours
Objective: This module will help you set up a professional dashbaord - learn how to visualize data through graphs and charts, create data models, and add interactivity.
Duration – 2.5 Hours
Objective: This section is all about working with data - and making it easy to work with. It will walk you through the different features of Excel to get your data prepared for analysis.
Duration – 2.5 Hours
Objective: It is an activity-based section with the goal of collaborating on all the topics you have learned so far to build dynamic MIS Reports. You'll learn to model different scenarios based on input, and assumptions.
Duration – 7.5 Hours
System Requirements
Computer Requirements
Software Requirements
Microsoft Excel: Version 2010 or later should be installed on your computer.
Secondary Monitor (optional, but recommended)
Having a secondary monitor, will greatly enhance your learning experience by allowing you to keep up with the trainer's pace and work with multiple Excel workbooks simultaneously.
Webcam
A functional webcam is required for active participation in online sessions. Please ensure that your webcam is working properly and positioned appropriately for clear visibility during collaborative sessions and discussions.
Course Fee
20 hours of Instructor-led training.
Real-time Excel Assignments
7 MIS Reporting Projects
30-Days post-training support (via Email)
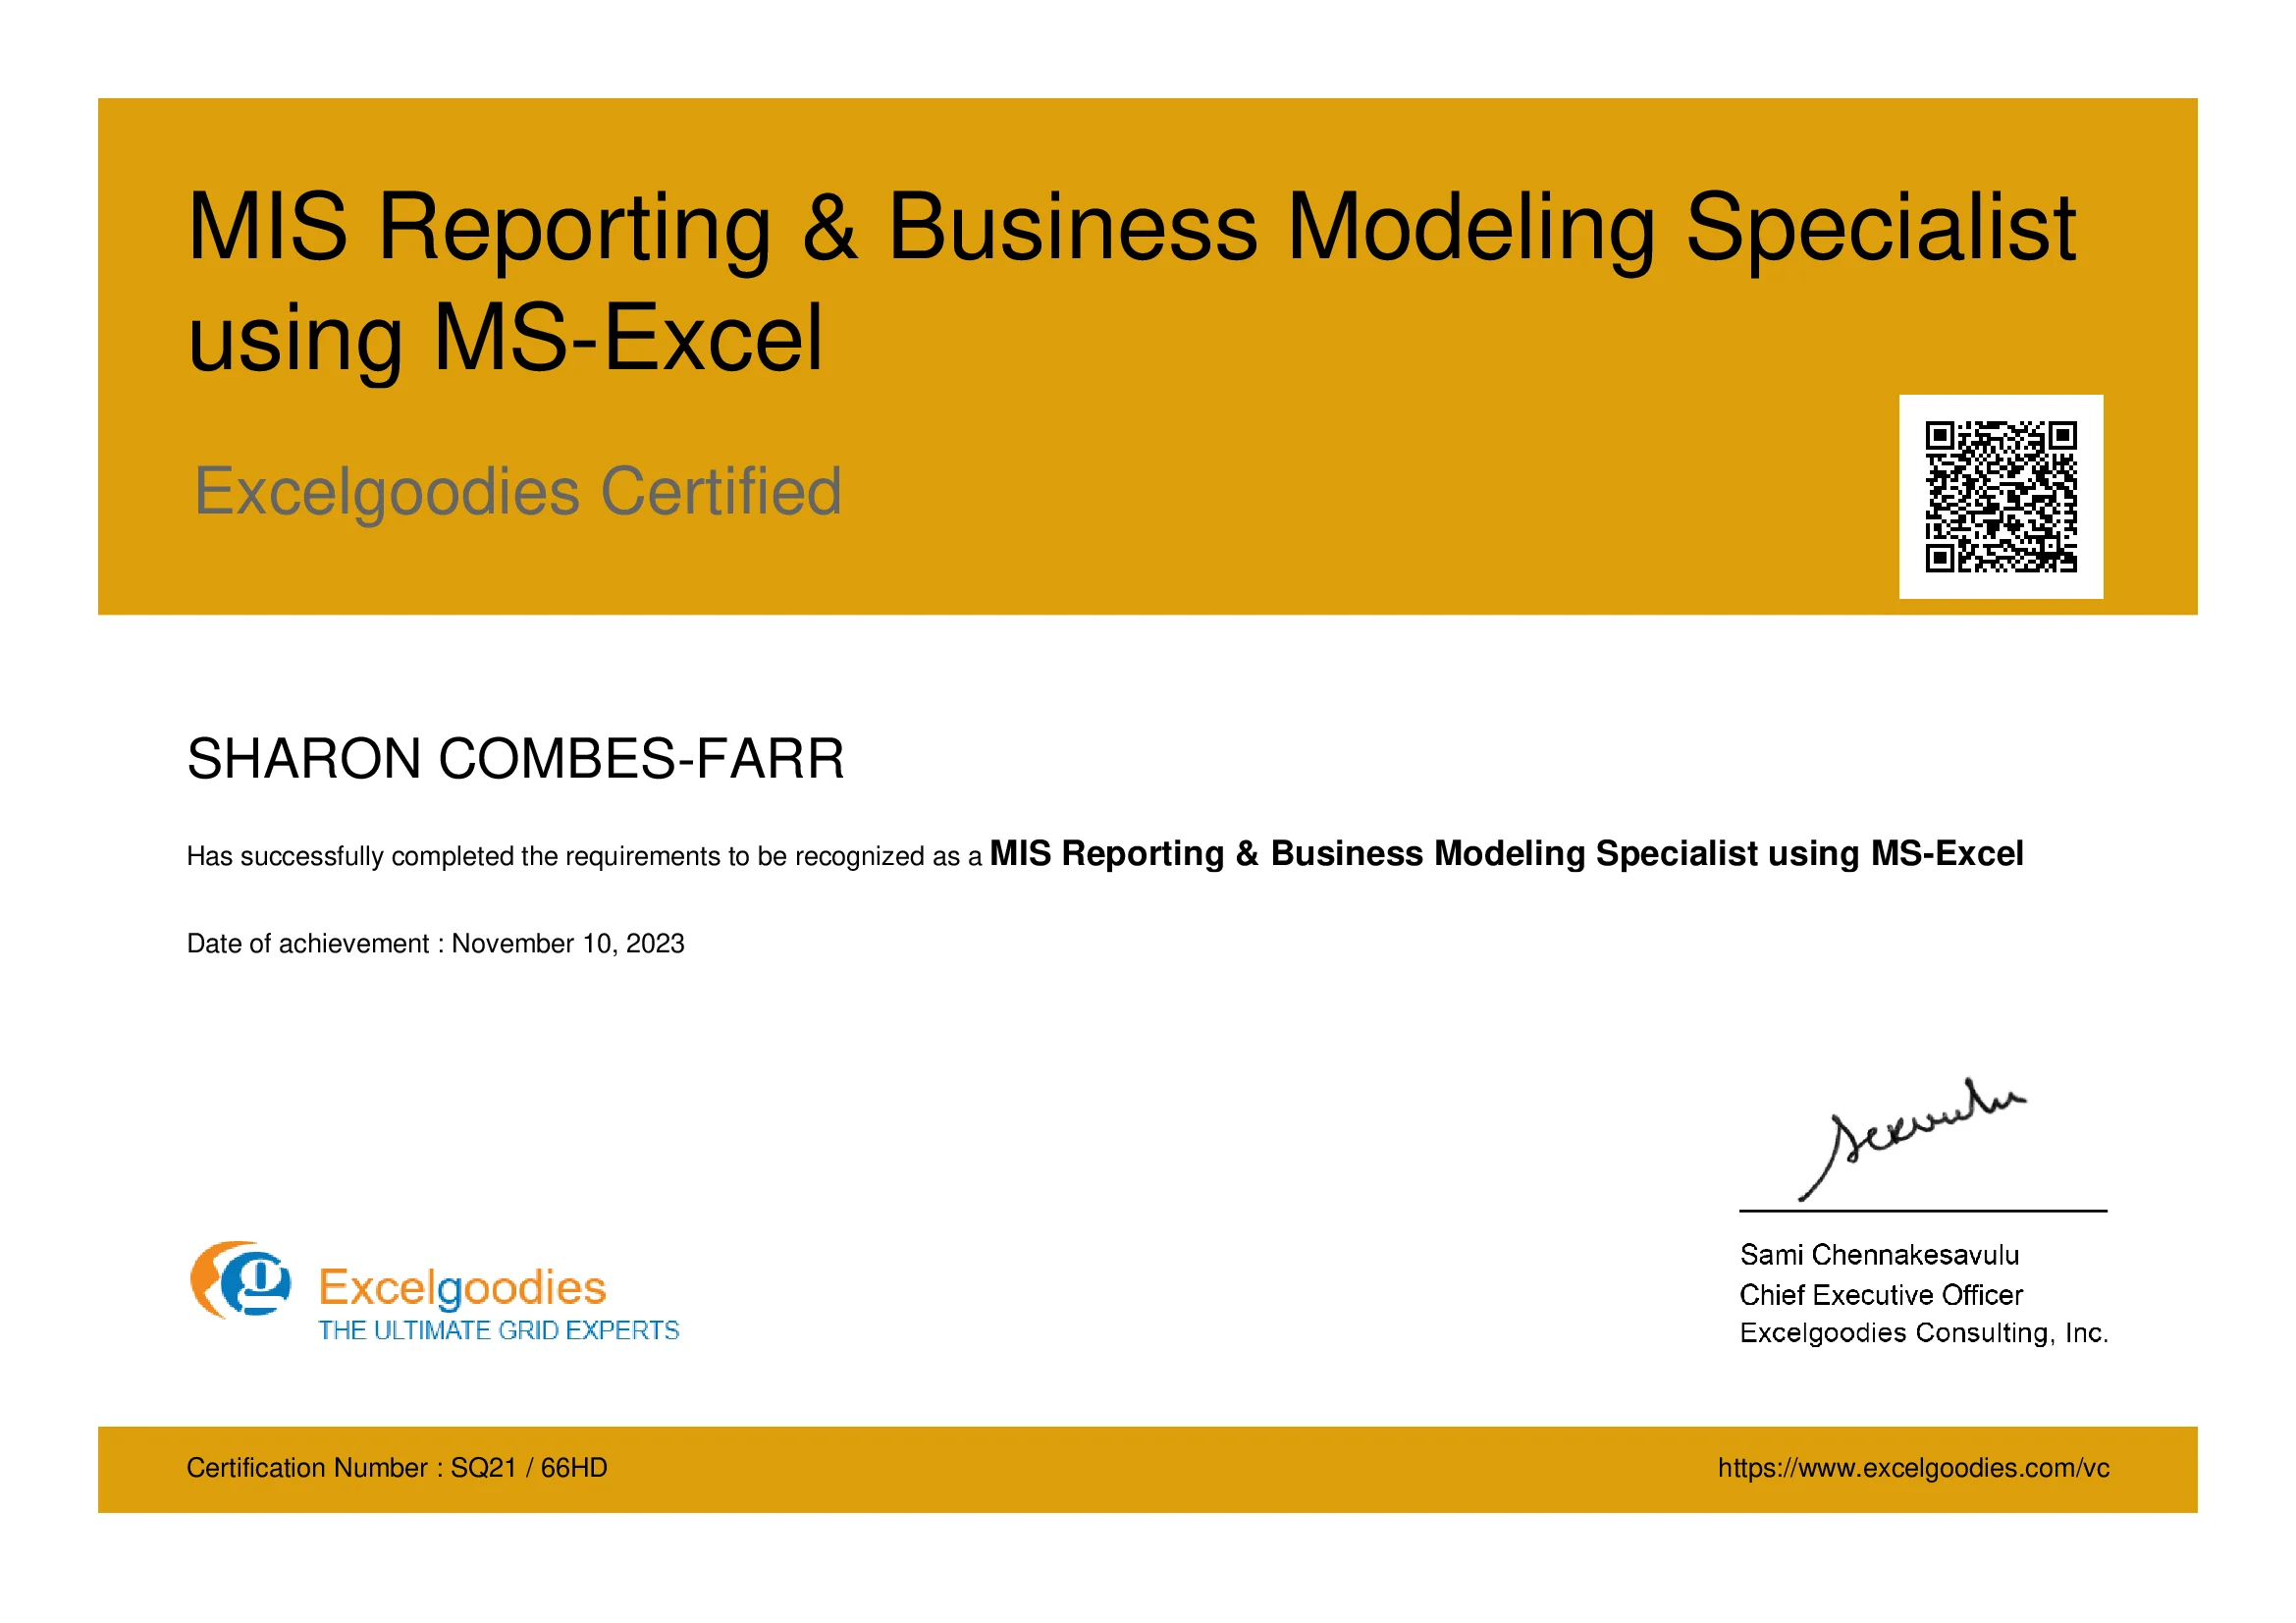
MIS Reporting Specialist Certificate
View Certificate
Advanced Excel & MIS Reporting Specialist Eligibility: On clearing post-training assessment. View Sample Certificate |
30,000+
Students Trained
18+
Year of Experience
4.9
Reviews
Mr. Sami is an exceptionally accomplished and certified Microsoft Trainer, possessing extensive expertise in the fields of Finance, HR, and Information Technology. With an impressive 14-year tenure in the industry, he has successfully trained and empowered over 23,000 professionals, and the number continues to grow.
He has undertaken assignments with the renowned IRS, The World Bank, Tata Chemicals, Buckman Laboratories, Standard Chartered, ING Barings and much more. His nature of going that Extra Mile has got him the startling popularity amongst the Excelgoodies prominent clients.
With his wealth of knowledge and dedication to delivering exceptional training experiences, Mr. Sami consistently exceeds the expectations of his clients and leaves a lasting impact on the professionals he trains.
Mr. Sami is an exceptionally accomplished and certified Microsoft Trainer, possessing extensive expertise in the fields of Finance, HR, and Information Technology. With an impressive 14-year tenure in the industry, he has successfully trained and empowered over 23,000 professionals, and the number continues to grow.
Throughout his illustrious career, Mr. Sami has collaborated with esteemed organizations such as the IRS, The World Bank, Mercedez-Benz, Comcast, Standard Chartered, and ING Barings, to name just a few. His unwavering commitment to going the extra mile has earned him a stellar reputation among Excelgoodies' prominent clients.
With his wealth of knowledge and dedication to delivering exceptional training experiences, Mr. Sami consistently exceeds the expectations of his clients and leaves a lasting impact on the professionals he trains.
A snapshot of what you'll be learning in 2 weeks.
20 hours of Instructor-led training.
Real-time Excel Assignments
7 MIS Reporting Projects
30-Days post-training support (via Email)
MIS Reporting Specialist Certificate
Objective: The term "basic" is subjective based on levels of knowledge, experience, exposure, etc. Basic for one individual doesn't have to be basic for another. Nearly all participants in this training are self-taught and have some Excel skills as well as some gaps.
The objective of this module is to fill gaps, bring everyone to the same level and empower them with comfort and confidence to learn Excel as a reporting solution and not as a computer tool.
Duration – 2.5 Hours (Rapid Session)
Objective: Master 60+ MS Excel formulas to dramatically simplify the work you do in Excel. By the end of the section, you'll be writing robust, elegant formulas from scratch.
Duration – 5 Hours
Objective: This module will help you set up a professional dashbaord - learn how to visualize data through graphs and charts, create data models, and add interactivity.
Duration – 2.5 Hours
Objective: This section is all about working with data - and making it easy to work with. It will walk you through the different features of Excel to get your data prepared for analysis.
Duration – 2.5 Hours
Objective: It is an activity-based section with the goal of collaborating on all the topics you have learned so far to build dynamic MIS Reports. You'll learn to model different scenarios based on input, and assumptions.
Duration – 7.5 Hours
Eligibility: On clearing post-training assessment
Sample Certificate: View here
Computer Requirements
Software Requirements
Microsoft Excel: Version 2010 or later should be installed on your computer.
Secondary Monitor (optional, but recommended)
Having a secondary monitor, will greatly enhance your learning experience by allowing you to keep up with the trainer's pace and work with multiple Excel workbooks simultaneously.
Webcam
A functional webcam is required for active participation in online sessions. Please ensure that your webcam is working properly and positioned appropriately for clear visibility during collaborative sessions and discussions.
Training Schedule
Course Fee
$39930,000+
Students Trained
18+
Year of Experience
4.9
Reviews
Mr. Sami is an exceptionally accomplished and certified Microsoft Trainer, possessing extensive expertise in the fields of Finance, HR, and Information Technology. With an impressive 14-year tenure in the industry, he has successfully trained and empowered over 23,000 professionals, and the number continues to grow.
He has undertaken assignments with the renowned IRS, The World Bank, Tata Chemicals, Buckman Laboratories, Standard Chartered, ING Barings and much more. His nature of going that Extra Mile has got him the startling popularity amongst the Excelgoodies prominent clients.
With his wealth of knowledge and dedication to delivering exceptional training experiences, Mr. Sami consistently exceeds the expectations of his clients and leaves a lasting impact on the professionals he trains.
Mr. Sami is an exceptionally accomplished and certified Microsoft Trainer, possessing extensive expertise in the fields of Finance, HR, and Information Technology. With an impressive 14-year tenure in the industry, he has successfully trained and empowered over 23,000 professionals, and the number continues to grow.
Throughout his illustrious career, Mr. Sami has collaborated with esteemed organizations such as the IRS, The World Bank, Mercedez-Benz, Comcast, Standard Chartered, and ING Barings, to name just a few. His unwavering commitment to going the extra mile has earned him a stellar reputation among Excelgoodies' prominent clients.
With his wealth of knowledge and dedication to delivering exceptional training experiences, Mr. Sami consistently exceeds the expectations of his clients and leaves a lasting impact on the professionals he trains.
Total Reviews
4583
Overall growth till now
Average Rating
4.9
Average rating this year
Graph
5
2.0K
4
1.0K
3
500
2
200
1
0
Star Rating
Trainer's Expertise
Course Structure
Course Content
Assignments
Certification Process
Scott A. Reifsynder
Power BI Training
Chief Financial Officer
Nexterus
United States
This class was extremely helpful in my knowledge and growth in these database, analysis and reporting tools. I really enjoyed the hands-on approach and got lots of “goodies” out of all the classes. Your approach, repetitiveness and patience is much appreciated and sincerely helped me learn how to accomplish these important tasks. Doing these activities again and again embedded these processes into my routines while I began strategizing how to best utilize these tools in my company’s reporting and analyses. I’d be happy to consider additional classes that you offer on related, important topics to continue enhancing my skills. Thank you very much for your teaching and training methods. I am also very grateful that you provided the daily sample dashboards, instruction steps and how-to descriptions.
Wendy Flowers
Power BI Training
Financial and Business Analyst
First Light
United States
This Power BI course was an exceptional training experience. It was very fast paced -- necessary as it covered Power Pivots, Power Query, DAX, Power BI, and SQL. Sami ran the training smoothly, staying after to help individuals with questions. We also are able to schedule up to two 30-minute sessions after the end of the course for guidance on projects. Highly recommend!
Tim Palacios
Power BI Training
WFM Data Developer
World Connection
United States
This course was excellent. Sami had a systematic approach to the course curriculum which I feel is key to most if not all learning experiences. He was very knowledgeable and very quick with troubleshooting and helping support when we had any challenges with our work. I am definitely going to take more courses from Excelgoodies. If you are an IT professional or require Data Analytics for your job, this is a great course and I highly recommend it. I think my only critique is that I would have like to have more time devoted to the database side of the class, but that is just a personal preference.
Total Reviews
4583
Overall growth till now
Average Rating
4.9
Average rating this year
Scott A. Reifsynder
Power BI Training
Chief Financial Officer
Nexterus
United States
This class was extremely helpful in my knowledge and growth in these database, analysis and reporting tools. I really enjoyed the hands-on approach and got lots of “goodies” out of all the classes. Your approach, repetitiveness and patience is much appreciated and sincerely helped me learn how to accomplish these important tasks. Doing these activities again and again embedded these processes into my routines while I began strategizing how to best utilize these tools in my company’s reporting and analyses. I’d be happy to consider additional classes that you offer on related, important topics to continue enhancing my skills. Thank you very much for your teaching and training methods. I am also very grateful that you provided the daily sample dashboards, instruction steps and how-to descriptions.
Wendy Flowers
Power BI Training
Financial and Business Analyst
First Light
United States
This Power BI course was an exceptional training experience. It was very fast paced -- necessary as it covered Power Pivots, Power Query, DAX, Power BI, and SQL. Sami ran the training smoothly, staying after to help individuals with questions. We also are able to schedule up to two 30-minute sessions after the end of the course for guidance on projects. Highly recommend!
Tim Palacios
Power BI Training
WFM Data Developer
World Connection
United States
This course was excellent. Sami had a systematic approach to the course curriculum which I feel is key to most if not all learning experiences. He was very knowledgeable and very quick with troubleshooting and helping support when we had any challenges with our work. I am definitely going to take more courses from Excelgoodies. If you are an IT professional or require Data Analytics for your job, this is a great course and I highly recommend it. I think my only critique is that I would have like to have more time devoted to the database side of the class, but that is just a personal preference.
Industry Insights
Excel
5 Common Excel Mistakes That Can Sabotage Your MIS Reports
Excel
5 Excel Functions Every MIS Professional Should Know
Excel
10 Ways Power Query Can Supercharge Your Excel Reports
Excel
5 Common Excel Mistakes That Can Sabotage Your MIS Reports
Excel
5 Excel Functions Every MIS Professional Should Know
Excel
10 Ways Power Query Can Supercharge Your Excel Reports
Contact Us
Excelgoodies Consulting, inc.
575 7th Avenue, 5th Floor
New York City, NY 10018
Tel: +1 650 491 3131
You will learn to use the right and hybrid technology for end-to-end advanced power reporting.
Tools: Power BI, Power Pivot, VBA, Excel,
M-Programming, MS-SQL, SSIS, and many more.
Power BI
Micorsoft T-SQL
MS-SQL Integrated Services
Python
Microsoft Excel VBA
MS-Excel
Power Query